Resources
 2011 Tohoku Earthquake and Tsunami - Missing persons in affected prefectures
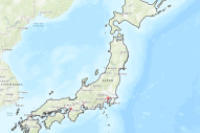
This layer describes the number of missing persons in prefectures affected by the 2011 Tohoku Earthquake and Tsunami as of 6 July 2011. The numbers were higher in Miyagi, Iwate and Fukushima Prefectures.
Type: Feature Service
Last Modified: September 16, 2019
 California Missing Persons
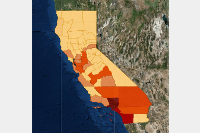
The feature layer depicts missing persons in the State of California for 2018
Type: Feature Service
Last Modified: February 9, 2019
 Disaster Related Missing Persons_WFL1
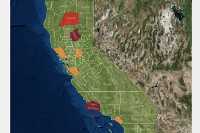
This map depicts the counties in California with the highest number of missing persons as a result of a natural disaster.
Type: Feature Service
Last Modified: February 10, 2019
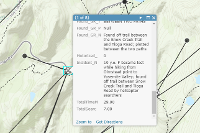
 Missing Person Cases in the Waterloo Region
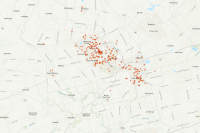
This web app pinpoints where and shows when all of the "missing person" cases occurred in the Waterloo Region.
Type: Web Mapping Application
Last Modified: November 16, 2023
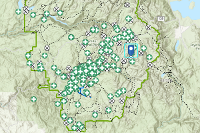
 YOSAR Missing Person Data 2000 - 2011
Eleven years (2000 - 2010) of search and rescue case incident reports from Yosemite National Park. This is a missing person subset.
Type: Feature Service
Last Modified: August 6, 2017
 MapSAR Incident Data Feature Layer Template
This is a feature layer template for use in missing person search operations.
Type: Feature Service
Last Modified: July 22, 2020
 Disaster Related Missing Persons
This app gives users a synopsis of missing persons data by California County as a result of natural disasters during 2018.
Type: Web Mapping Application
Last Modified: March 7, 2019
 Yosemite Search And Rescue Missing Person Searches (NAPSG Copy)
Yosemite Search And Rescue Georeferencing Project
Type: Web Map
Last Modified: August 22, 2019
 Indicator 13.1.1: Number of missing persons due to disaster (number)
Indicator 13.1.1: Number of missing persons due to disaster (number)
Type: Feature Service
Last Modified: September 23, 2021
 Indicator 1.5.1: Number of missing persons due to disaster (number)
Indicator 1.5.1: Number of missing persons due to disaster (number)
Type: Feature Service
Last Modified: September 23, 2021
 SARGIS8_MapSAR_Layer
MapSAR Online is an extension of the MapSAR project to provide basic mapping capability for search and rescue teams through an easy to use interface.
Type: Feature Service
Last Modified: May 30, 2019
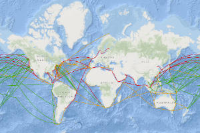 Global port and vessel routes_WFL1
The Ocean Basemap includes a vector tile layer for bathymetry, surface and subsurface feature names, and derived depths. This map is designed to be used as a basemap by marine GIS professionals and a reference map by anyone interested in ocean data.
Type: Feature Service
Last Modified: March 25, 2023
 Day/Night Terminator
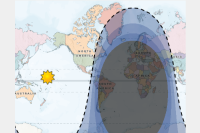
Layer item that maintains Daytime, Nighttime, and Twilight coverage (Solar Terminator) as well as the Horizon and the Sun's position as the Earth orbits the Sun.
Type: Feature Service
Last Modified: February 6, 2023
 Landuse Mapping and Analysis in Ibeno, Akwa Ibom State, Nigeria
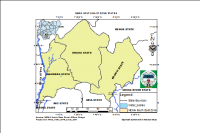
The satellite imagery (Land sat TM Imagery) was extracted from USGS and analyzed using Arc Map 10.5.0. Undeveloped: The undeveloped is depicted in gray colour and they are those portions of Land in the study that are barland areas. It was observed that the bare land is increased as a result of the following factors from our field observations such as land reclamation, rapid population growth, rapid urbanization which include more schools, hospitals, industries, residents, etc. Vegetation: The vegetation of the area in the satellite imagery is depicted with green colour. It was observed that the vegetation is decreasing as a result of the following factors from our field observations such as deforestation, rapid population growth, rapid urbanization which include more number of schools, hospitals, industries, residents, etc. Water Body: The water bodies in the study area include beaches, lakes, etc. The water body is depicted in blue colour. Built-Up: The built-up area comprises the residents, markets, schools, land reclamation, rapid population growth, and rapid urbanization which include the number of schools, hospitals, industries, residents, etc hospitals, banks, etc. From the observation of the satellite imagery we observed that built up areas is increasing due to rapid population growth, rapid urbanization which includes the number of schools, hospitals, industries, residents, and construction inside the campus etc. The Land Use Map shows area coverage and percentage coverage of 2020 Land Use Types. Undeveloped area: Area (Hectares) is 2074.5 while the percentage is 9.78%. Vegetation: Area (Hectares) is 10615.77 while the percentage is 50.04%. Water Body: Area (Hectares) is 1797.75 while the percentage is 8.47%. Built Up Area: Area (Hectares) is 6726.96 while the percentage is 31.71%. Total Area (Hectares) is 21214.98 while the total percentage is 100%. Source: Author GIS analysis
Type: Map Package
Last Modified: August 22, 2021
 Turkey Point Evacuee Tracking
Feature layer that is produced from the Turkey Point Evacuation Form.
Type: Feature Service
Last Modified: October 24, 2018
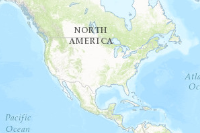
 Disasters from start to finish
Loma Prieta Earthquake, California Floods, California Wildfires
Type: Web Map
Last Modified: May 9, 2021
 NMPF_SafetyAtSea
Web map for use in the Marine Spatial Planning Experience Builder site
Type: Web Map
Last Modified: November 22, 2022
 NMPF_SafetyAtSea
Web map for use in the Marine Spatial Planning Experience Builder site
Type: Web Map
Last Modified: January 4, 2023
 City of Winchester Legislative Agenda 2023
Story map used to outline the City of Winchester's priorities and positions for the 2023 legislative agenda.
Type: StoryMap
Last Modified: March 21, 2024
 monrovia_cul_sec_infra
Cultural, communication, and critical infrastructure for Monrovia, Liberia, for Ebola activity for Penn State GeoIntelligence Massive Open Online Course
Type: Feature Service
Last Modified: January 19, 2015