A web application that allows the general public to review event and incident information published by the fire or police department.
CrawlUsing paper maps to periodically give current, visual information to the community and media is a valuable tool for Public Information Officers to describe an incident and its impact on the local community. These maps contain the most current releasable information on the situation, evacuation areas, shelter locations, and expected events over the next operational period. |
WalkWeb-based maps are the next step in creating valuable information that needs to be communicated to the community and media. These maps can be posted more often than paper maps can be created and distributed and have the added advantage of being the single source of good information – avoiding the confusion the distribution of paper maps can create. |
RunThe best use of GIS to support Public Safety Agencies happens when the PIO has immediate and constant access to dynamic incident information. These systems allow field units to input observations they have in the field, plans/intel units to see these markups and QA/QC them, and the PIO to watch it live, select the incident, and publish the online mapping to the public and media with one click. This drastically speeds the flow of information, giving the public access to information almost as fast as it is occuring. This workflow has the benefit of making the PIO the best source of information thus allowing the incident to communicate critical, time-sensitive information to everyone involved. This is important because very often the incident and PIO are slow to release information (struggling to get it) and the roar of the public, the internet, social media, and mainstream media overwhelm the process. By quickly and proactively releasing information, the incident PIO becomes the ‘lightning rod’ for attention and best communicates the important message. |
| Example: Search Public Information at ArcGIS Online | Example: Emergency Management Maps |
More Resources
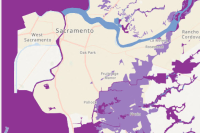 USA Flood Hazard Areas
This feature layer displays Flood Hazard Areas from the Flood Insurance Rate Map created by the Federal Emergency Management Agency.
Type: Feature Service
Last Modified: September 20, 2023
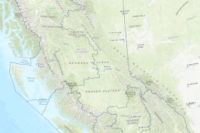 Emergency Management and Climate Readiness Boundaries
This is a reference layer for EmergencyMapBC. Jurisdictional boundaries for Emergency Management BC (EMBC). This datas...
Type: Feature Service
Last Modified: July 24, 2023
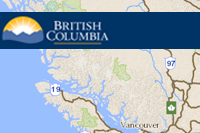 Emergency Management BC Boundaries
Jurisdictional boundaries for Emergency Management BC (EMBC). This datas...
Type: Feature Service
Last Modified: April 11, 2023
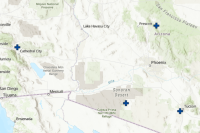 National Shelter System - Open Shelters
This map layer displays data from the Federal Emergency Management Agency - National Shelter System database.
Type: Map Service
Last Modified: July 27, 2023
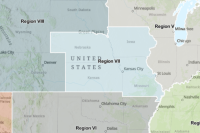 Federal Emergency Management Agency Regions
This feature layer, derived from Federal Emergency Management Agency data, provides information on the agency's administrative regions.
Type: Feature Service
Last Modified: February 6, 2024
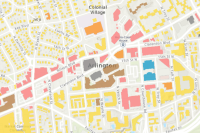 USA Structures
This feature layer, utilizing Federal Emergency Management Agency data, displays footprints for all structures (buildings) greater than 450 square feet in the United States and its territories.
Type: Feature Service
Last Modified: February 1, 2024
 Federal Emergency Management Agency Regional Headquarters
This feature layer, derived from Federal Emergency Management Agency data, depicts the agency's Area and Regional offices and National Headquarters.
Type: Feature Service
Last Modified: July 30, 2023
 NYC Emergency Management 2022 - 2026 Strategic Plan
NYC Emergency Management's 2022 - 2026 Strategic Plan
Type: Web Mapping Application
Last Modified: July 15, 2022
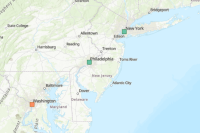
 Point Address Labels - FL Emergency Management Region 2
This map image layer displays point addresses for all counties in Florida Emergency Management Region 2. (Columbia, Dixie, Franklin, Gadsden, Hamilton, Jefferson, Lafayette, Leon, Liberty, Madison, Suwannee, Taylor, Wakulla)
Type: Map Service
Last Modified: March 15, 2024
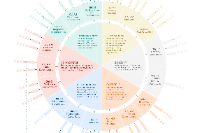
 GIS Data and Tools for Today's Emergency Managers
This is a Cascade Story Map that contains the information on the data, tools, and workflows produced and utilized for the project, GIS Data and Tools for Today's Emergency Managers. The image source for the thumbnail is Esri, Flickr, and Jason Lowe.
Type: Web Mapping Application
Last Modified: March 21, 2018